


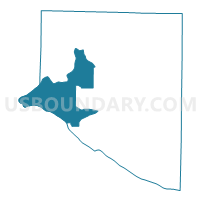
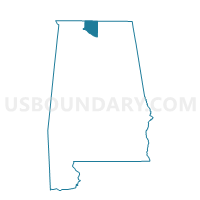
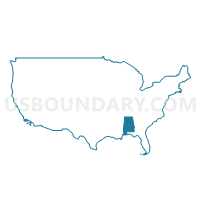
Census Tract 204.01, Limestone County, Alabama
About
Outline

Summary
| Unique Area Identifier | 431922 |
| Name | Census Tract 204.01 |
| County | Limestone County |
| State | Alabama |
| Area (square miles) | 69.83 |
| Land Area (square miles) | 60.12 |
| Water Area (square miles) | 9.71 |
| % of Land Area | 86.10 |
| % of Water Area | 13.90 |
| Latitude of the Internal Point | 34.79558530 |
| Longtitude of the Internal Point | -87.14604350 |
| Total Population | 5,961 |
| Total Housing Units | 3,120 |
| Total Households | 2,399 |
| Median Age | 41.3 |
Maps
Graphs
Select a template below for downloading or customizing gragh for Census Tract 204.01, Limestone County, Alabama


Neighbors
Neighoring Census Tract (by Name) Neighboring Census Tract on the Map
- Census Tract 118.02, Lauderdale County, AL
- Census Tract 202.01, Limestone County, AL
- Census Tract 202.02, Limestone County, AL
- Census Tract 203, Limestone County, AL
- Census Tract 204.02, Limestone County, AL
- Census Tract 211, Limestone County, AL
- Census Tract 9791, Lawrence County, AL
- Census Tract 9792, Lawrence County, AL
Top 10 Neighboring County Subdivision (by Population) Neighboring County Subdivision on the Map
- Athens CCD, Limestone County, AL (69,761)
- Rogersville CCD, Lauderdale County, AL (8,630)
- Town Creek-Courtland CCD, Lawrence County, AL (4,655)
- Salem CCD, Limestone County, AL (3,583)
- Hillsboro CCD, Lawrence County, AL (1,668)
Top 10 Neighboring Unified School District (by Population) Neighboring Unified School District on the Map
- Limestone County School District, AL (57,348)
- Lauderdale County School District, AL (53,390)
- Lawrence County School District, AL (34,339)
Top 10 Neighboring State Legislative District Lower Chamber (by Population) Neighboring State Legislative District Lower Chamber on the Map
- State House District 4, AL (51,181)
- State House District 5, AL (48,495)
- State House District 2, AL (45,462)
- State House District 7, AL (40,956)
Top 10 Neighboring State Legislative District Upper Chamber (by Population) Neighboring State Legislative District Upper Chamber on the Map
- State Senate District 2, AL (179,058)
- State Senate District 1, AL (135,057)
- State Senate District 4, AL (123,291)
Top 10 Neighboring 111th Congressional District (by Population) Neighboring 111th Congressional District on the Map
Top 10 Neighboring 5-Digit ZIP Code Tabulation Area (by Population) Neighboring 5-Digit ZIP Code Tabulation Area on the Map
Explore Neighbors on the MapData
Demographic, Population, Households, and Housing Units
** Data sources from census 2010 **
Show Data on Map
Download Full List as CSV
Download Quick Sheet as CSV
| Subject | This Area | Limestone County | Alabama | National |
|---|---|---|---|---|
| POPULATION | ||||
| Total Population Map | 5,961 | 82,782 | 4,779,736 | 308,745,538 |
| POPULATION, HISPANIC OR LATINO ORIGIN | ||||
| Not Hispanic or Latino Map | 5,822 | 78,191 | 4,594,134 | 258,267,944 |
| Hispanic or Latino Map | 139 | 4,591 | 185,602 | 50,477,594 |
| POPULATION, RACE | ||||
| White alone Map | 5,398 | 66,506 | 3,275,394 | 223,553,265 |
| Black or African American alone Map | 329 | 10,429 | 1,251,311 | 38,929,319 |
| American Indian and Alaska Native alone Map | 21 | 547 | 28,218 | 2,932,248 |
| Asian alone Map | 14 | 924 | 53,595 | 14,674,252 |
| Native Hawaiian and Other Pacific Islander alone Map | 0 | 42 | 3,057 | 540,013 |
| Some Other Race alone Map | 78 | 2,866 | 96,910 | 19,107,368 |
| Two or More Races Map | 121 | 1,468 | 71,251 | 9,009,073 |
| POPULATION, SEX | ||||
| Male Map | 2,988 | 41,910 | 2,320,188 | 151,781,326 |
| Female Map | 2,973 | 40,872 | 2,459,548 | 156,964,212 |
| POPULATION, AGE (18 YEARS) | ||||
| 18 years and over Map | 4,599 | 62,923 | 3,647,277 | 234,564,071 |
| Under 18 years | 1,362 | 19,859 | 1,132,459 | 74,181,467 |
| POPULATION, AGE | ||||
| Under 5 years | 355 | 5,352 | 304,957 | 20,201,362 |
| 5 to 9 years | 356 | 5,414 | 308,229 | 20,348,657 |
| 10 to 14 years | 400 | 5,686 | 319,655 | 20,677,194 |
| 15 to 17 years | 251 | 3,407 | 199,618 | 12,954,254 |
| 18 and 19 years | 131 | 1,910 | 143,853 | 9,086,089 |
| 20 years | 69 | 962 | 72,318 | 4,519,129 |
| 21 years | 42 | 880 | 68,473 | 4,354,294 |
| 22 to 24 years | 170 | 2,865 | 194,531 | 12,712,576 |
| 25 to 29 years | 332 | 5,515 | 311,034 | 21,101,849 |
| 30 to 34 years | 352 | 5,536 | 297,888 | 19,962,099 |
| 35 to 39 years | 423 | 5,889 | 308,430 | 20,179,642 |
| 40 to 44 years | 390 | 6,326 | 311,071 | 20,890,964 |
| 45 to 49 years | 500 | 6,762 | 346,369 | 22,708,591 |
| 50 to 54 years | 537 | 6,205 | 347,485 | 22,298,125 |
| 55 to 59 years | 472 | 5,166 | 311,906 | 19,664,805 |
| 60 and 61 years | 180 | 1,923 | 116,144 | 7,113,727 |
| 62 to 64 years | 273 | 2,797 | 159,983 | 9,704,197 |
| 65 and 66 years | 120 | 1,505 | 89,406 | 5,319,902 |
| 67 to 69 years | 163 | 2,009 | 120,231 | 7,115,361 |
| 70 to 74 years | 199 | 2,615 | 160,864 | 9,278,166 |
| 75 to 79 years | 128 | 1,889 | 122,836 | 7,317,795 |
| 80 to 84 years | 70 | 1,177 | 88,771 | 5,743,327 |
| 85 years and over | 48 | 992 | 75,684 | 5,493,433 |
| MEDIAN AGE BY SEX | ||||
| Both sexes Map | 41.30 | 38.40 | 37.90 | 37.20 |
| Male Map | 41.20 | 37.60 | 36.40 | 35.80 |
| Female Map | 41.50 | 39.20 | 39.10 | 38.50 |
| HOUSEHOLDS | ||||
| Total Households Map | 2,399 | 31,446 | 1,883,791 | 116,716,292 |
| HOUSEHOLDS, HOUSEHOLD TYPE | ||||
| Family households: Map | 1,771 | 22,876 | 1,276,440 | 77,538,296 |
| Husband-wife family Map | 1,400 | 17,923 | 902,556 | 56,510,377 |
| Other family: Map | 371 | 4,953 | 373,884 | 21,027,919 |
| Male householder, no wife present Map | 134 | 1,368 | 86,147 | 5,777,570 |
| Female householder, no husband present Map | 237 | 3,585 | 287,737 | 15,250,349 |
| Nonfamily households: Map | 628 | 8,570 | 607,351 | 39,177,996 |
| Householder living alone Map | 551 | 7,468 | 516,696 | 31,204,909 |
| Householder not living alone Map | 77 | 1,102 | 90,655 | 7,973,087 |
| HOUSEHOLDS, HISPANIC OR LATINO ORIGIN OF HOUSEHOLDER | ||||
| Not Hispanic or Latino householder: Map | 2,370 | 30,360 | 1,836,557 | 103,254,926 |
| Hispanic or Latino householder: Map | 29 | 1,086 | 47,234 | 13,461,366 |
| HOUSEHOLDS, RACE OF HOUSEHOLDER | ||||
| Householder who is White alone | 2,214 | 26,273 | 1,339,068 | 89,754,352 |
| Householder who is Black or African American alone | 125 | 3,669 | 472,208 | 14,129,983 |
| Householder who is American Indian and Alaska Native alone | 9 | 210 | 11,057 | 939,707 |
| Householder who is Asian alone | 2 | 231 | 17,275 | 4,632,164 |
| Householder who is Native Hawaiian and Other Pacific Islander alone | 0 | 13 | 899 | 143,932 |
| Householder who is Some Other Race alone | 17 | 686 | 23,630 | 4,916,427 |
| Householder who is Two or More Races | 32 | 364 | 19,654 | 2,199,727 |
| HOUSEHOLDS, HOUSEHOLD TYPE BY HOUSEHOLD SIZE | ||||
| Family households: Map | 1,771 | 22,876 | 1,276,440 | 77,538,296 |
| 2-person household Map | 832 | 10,207 | 559,181 | 31,882,616 |
| 3-person household Map | 446 | 5,407 | 311,512 | 17,765,829 |
| 4-person household Map | 309 | 4,546 | 240,978 | 15,214,075 |
| 5-person household Map | 126 | 1,782 | 105,643 | 7,411,997 |
| 6-person household Map | 45 | 596 | 37,152 | 3,026,278 |
| 7-or-more-person household Map | 13 | 338 | 21,974 | 2,237,501 |
| Nonfamily households: Map | 628 | 8,570 | 607,351 | 39,177,996 |
| 1-person household Map | 551 | 7,468 | 516,696 | 31,204,909 |
| 2-person household Map | 68 | 935 | 73,110 | 6,360,012 |
| 3-person household Map | 3 | 101 | 11,429 | 992,156 |
| 4-person household Map | 6 | 44 | 4,348 | 411,171 |
| 5-person household Map | 0 | 16 | 1,128 | 126,634 |
| 6-person household Map | 0 | 5 | 358 | 48,421 |
| 7-or-more-person household Map | 0 | 1 | 282 | 34,693 |
| HOUSING UNITS | ||||
| Total Housing Units Map | 3,120 | 34,977 | 2,171,853 | 131,704,730 |
| HOUSING UNITS, OCCUPANCY STATUS | ||||
| Occupied Map | 2,399 | 31,446 | 1,883,791 | 116,716,292 |
| Vacant Map | 721 | 3,531 | 288,062 | 14,988,438 |
| HOUSING UNITS, OCCUPIED, TENURE | ||||
| Owned with a mortgage or a loan Map | 1,185 | 16,575 | 832,010 | 52,979,430 |
| Owned free and clear Map | 681 | 7,612 | 480,579 | 23,006,644 |
| Renter occupied Map | 533 | 7,259 | 571,202 | 40,730,218 |
| HOUSING UNITS, VACANT, VACANCY STATUS | ||||
| For rent Map | 134 | 938 | 79,265 | 4,137,567 |
| Rented, not occupied Map | 4 | 66 | 3,761 | 206,825 |
| For sale only Map | 115 | 664 | 35,903 | 1,896,796 |
| Sold, not occupied Map | 23 | 185 | 9,227 | 421,032 |
| For seasonal, recreational, or occasional use Map | 316 | 657 | 63,890 | 4,649,298 |
| For migrant workers Map | 12 | 17 | 238 | 24,161 |
| Other vacant Map | 117 | 1,004 | 95,778 | 3,652,759 |
| HOUSING UNITS, OCCUPIED, AVERAGE HOUSEHOLD SIZE BY TENURE | ||||
| Total: Map | 2.48 | 2.54 | 2.48 | 2.58 |
| Owner occupied Map | 2.44 | 2.56 | 2.52 | 2.65 |
| Renter occupied Map | 2.64 | 2.47 | 2.37 | 2.44 |
| HOUSING UNITS, OCCUPIED, TENURE BY RACE OF HOUSEHOLDER | ||||
| Owner occupied: Map | 1,866 | 24,187 | 1,312,589 | 75,986,074 |
| Householder who is White alone Map | 1,741 | 20,925 | 1,021,059 | 63,446,275 |
| Householder who is Black or African American alone Map | 82 | 2,388 | 254,596 | 6,261,464 |
| Householder who is American Indian and Alaska Native alone Map | 6 | 146 | 7,637 | 509,588 |
| Householder who is Asian alone Map | 2 | 173 | 9,284 | 2,688,861 |
| Householder who is Native Hawaiian and Other Pacific Islander alone Map | 0 | 7 | 359 | 61,911 |
| Householder who is Some Other Race alone Map | 12 | 298 | 8,345 | 1,975,817 |
| Householder who is Two or More Races Map | 23 | 250 | 11,309 | 1,042,158 |
| Renter occupied: Map | 533 | 7,259 | 571,202 | 40,730,218 |
| Householder who is White alone Map | 473 | 5,348 | 318,009 | 26,308,077 |
| Householder who is Black or African American alone Map | 43 | 1,281 | 217,612 | 7,868,519 |
| Householder who is American Indian and Alaska Native alone Map | 3 | 64 | 3,420 | 430,119 |
| Householder who is Asian alone Map | 0 | 58 | 7,991 | 1,943,303 |
| Householder who is Native Hawaiian and Other Pacific Islander alone Map | 0 | 6 | 540 | 82,021 |
| Householder who is Some Other Race alone Map | 5 | 388 | 15,285 | 2,940,610 |
| Householder who is Two or More Races Map | 9 | 114 | 8,345 | 1,157,569 |
| HOUSING UNITS, OCCUPIED, TENURE BY HISPANIC OR LATINO ORIGIN OF HOUSEHOLDER | ||||
| Owner occupied: Map | 1,866 | 24,187 | 1,312,589 | 75,986,074 |
| Not Hispanic or Latino householder Map | 1,846 | 23,645 | 1,292,679 | 69,617,625 |
| Hispanic or Latino householder Map | 20 | 542 | 19,910 | 6,368,449 |
| Renter occupied: Map | 533 | 7,259 | 571,202 | 40,730,218 |
| Not Hispanic or Latino householder Map | 524 | 6,715 | 543,878 | 33,637,301 |
| Hispanic or Latino householder Map | 9 | 544 | 27,324 | 7,092,917 |
| HOUSING UNITS, OCCUPIED, TENURE BY HOUSEHOLD SIZE | ||||
| Owner occupied: Map | 1,866 | 24,187 | 1,312,589 | 75,986,074 |
| 1-person household Map | 410 | 5,006 | 305,558 | 16,453,569 |
| 2-person household Map | 759 | 9,281 | 485,458 | 27,618,605 |
| 3-person household Map | 332 | 4,272 | 228,710 | 12,517,563 |
| 4-person household Map | 241 | 3,606 | 179,211 | 10,998,793 |
| 5-person household Map | 88 | 1,371 | 74,745 | 5,057,765 |
| 6-person household Map | 28 | 426 | 24,906 | 1,965,796 |
| 7-or-more-person household Map | 8 | 225 | 14,001 | 1,373,983 |
| Renter occupied: Map | 533 | 7,259 | 571,202 | 40,730,218 |
| 1-person household Map | 141 | 2,462 | 211,138 | 14,751,340 |
| 2-person household Map | 141 | 1,861 | 146,833 | 10,624,023 |
| 3-person household Map | 117 | 1,236 | 94,231 | 6,240,422 |
| 4-person household Map | 74 | 984 | 66,115 | 4,626,453 |
| 5-person household Map | 38 | 427 | 32,026 | 2,480,866 |
| 6-person household Map | 17 | 175 | 12,604 | 1,108,903 |
| 7-or-more-person household Map | 5 | 114 | 8,255 | 898,211 |
Loading...